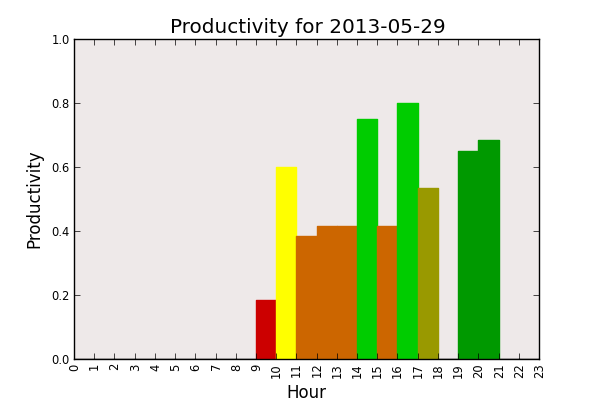
Productivity for 29th May, 2013
I coded up a script to output a chart of what my productivity looks like for the day. It is based on my Pomodoro software that logs all the time-boxes to my calendar on Mac OS/X. My program extracts all the information and constructs a nice looking chart. The idea is that I track what things are making me more productive.
You can find the script over in my GitHub repository