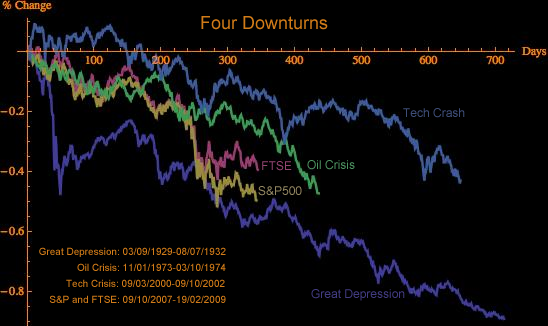
A while ago, I created a Mathematica plot comparing the Great Depression, the Tech Crash and the Oil Crisis with the current financial crisis. This analysis was inspired by a chart I saw last year comparing these recessions with our current situation. Anyway, I thought it was worth bringing the chart up-to-date.
[Edit] The original chart I saw was this one.[/Edit]
[caption id="attachment_166" align="alignnone" width="548" caption="Comparison of four economic downturns"] [/caption]